-
Dear Data #2: Weekly Cleaning Habits

At the beginning of the semester in my data visualization course, I was tasked with producing my own data chart after exploring the Dear Data Project, a year-long, analog data drawing project by two information designers, Giorgia Lupi and Stefanie Posavec, in an effort to stay connected and collect and share data about each of their lives from different…
-
Data as a storyteller

This week, I have been tasked with answering the question: What makes a data narrative persuasive? And to this, I refer to a quote I read not too long ago. “While we cannot make them care about a topic, we can try to utilize their existing beliefs to help them adopt new beliefs. Intentional or…
-
Mapping the world of data
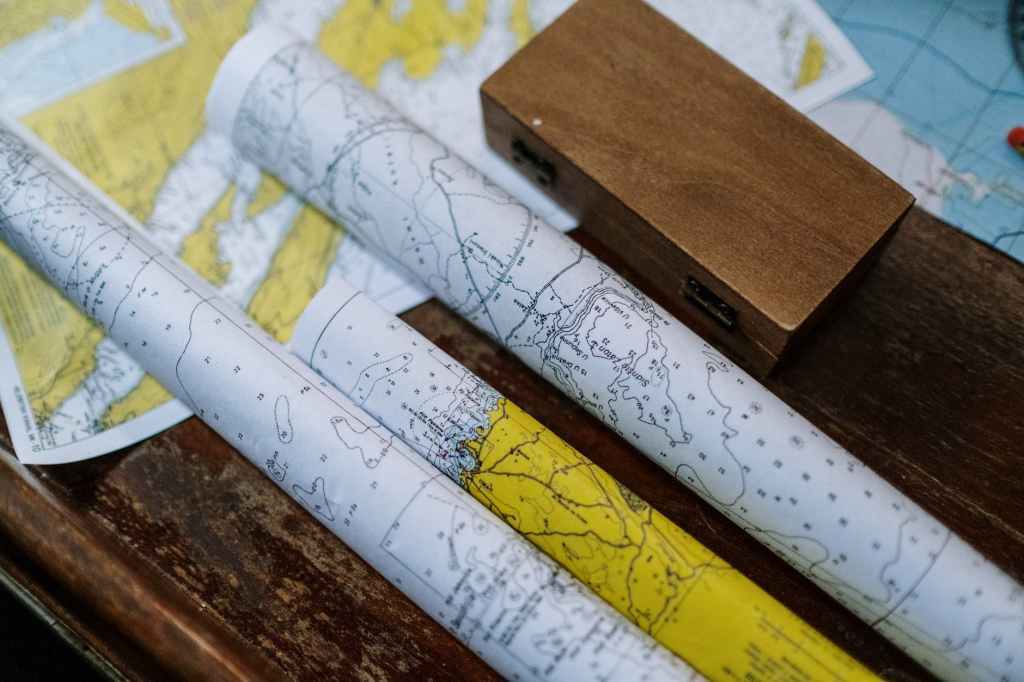
This week I experimented with different types of maps and other displays of data on an online platform called Datawrapper. I had so much fun using this tool to create colorful visualizations of data that were intersting to me including: Depression rates per state, hours worked each week per state, famous landmarks in Rome, Italy,…
-
Dear Data #1

At the beginning of my first graduate course on data visualization, I was introduced to the Dear Data Project. Dear Data is a year-long, analog data drawing project by two information designers, Giorgia Lupi and Stefanie Posavec, in an effort to stay connected and collect and share data about each of their lives from different sides of the Atlantic…
-
Time and place: The four methods of data visualization

While collecting data of my own, I found myself stumped when asked what type of graphic or visual I wanted to use to showcase my findings. There are so many types and they all serve different purposes, and as I said in my previous blog, the visual selection process is everything. So, I took to…
-
Data visualization, a solution to data overload

If I’m being honest, I didn’t know anything about data visualization a week ago. I unknowingly came across it many times and in many forms, such as bar charts, pie graphs, and more, but I never thought too much into it. But that’s the thing, these graphics are so effective because people don’t have to…
-
Subscribe
Subscribed
Already have a WordPress.com account? Log in now.
